Biomass
OOB RMSE is 2.76× the between-member spread
- Between-member spread
- 5.85 Mg/ha
- Downscaling out-of-bag RMSE
- 16.16 Mg/ha
2026Google Summer of Code, PEcAn Project
A 100-member North American carbon reanalysis benchmarked against established model ensembles and tested to determine whether its ensemble uncertainty is calibrated.
01The first question
PEcAn’s North American reanalysis assimilates satellite and ground-based observations into the SIPNET process model, producing 1 km, 100-member estimates of carbon and water pools across the continent. But before this project, it had never been benchmarked head-to-head against established model ensembles using ILAMB.
So the work began with that comparison, end to end. Convert the reanalysis into ILAMB-compatible fields, regrid CMIP6 and TRENDY onto the same grid, then score every model and all 100 PEcAn members individually against the same observational benchmarks.
The three benchmarked quantities span different parts of the terrestrial carbon system. Leaf area index describes the canopy, aboveground biomass captures carbon stored in vegetation, and soil carbon captures carbon stored belowground. Every ratio quoted later in this page belongs to one of these three.
02Scoring the mean
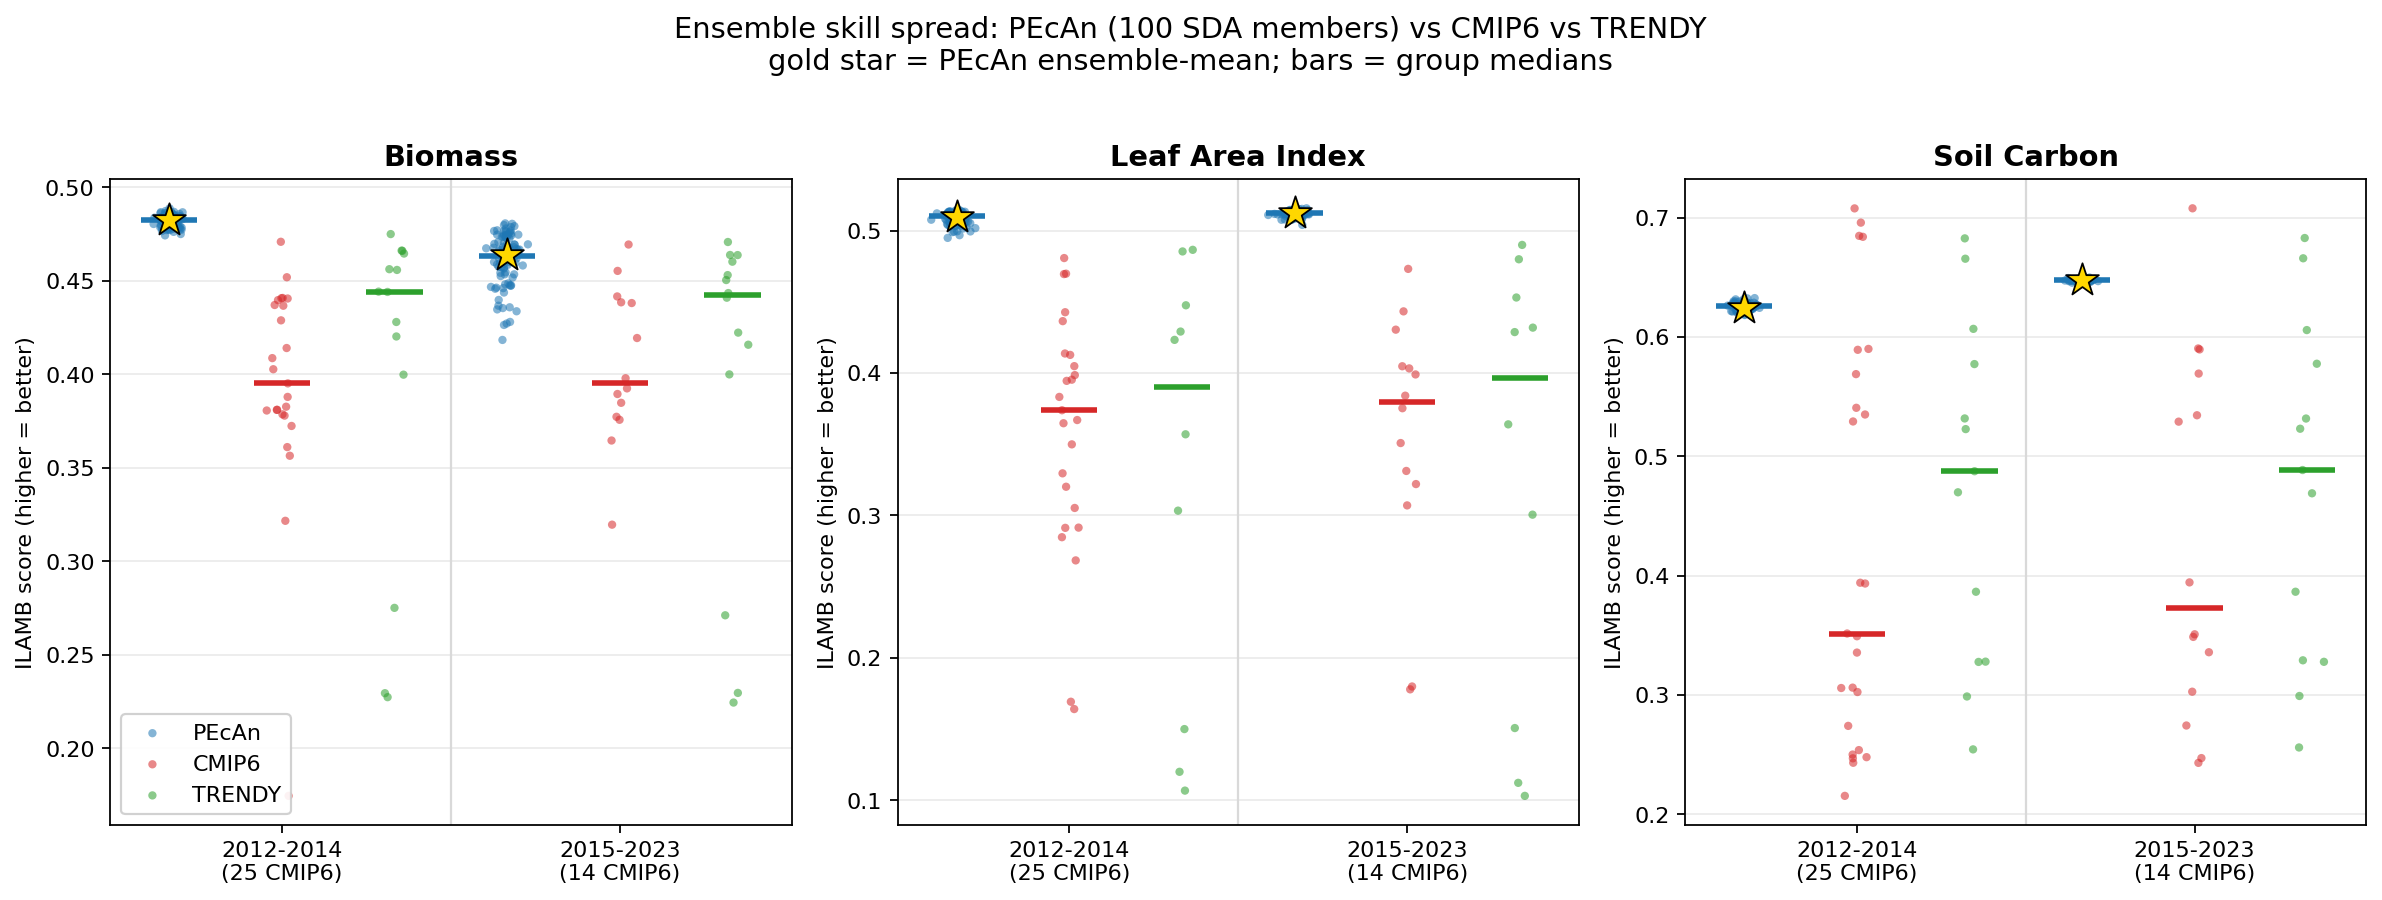
ILAMB score per variable, higher is better: The left group covers 2012 to 2014 and the right group covers 2015 to 2023, and the short horizontal bar marks each group’s median. This measures how well each member scores, not how wide its uncertainty is.
Explore the live ILAMB scorecard The full scorecard, with bias, RMSE, seasonal cycle and spatial distribution scored for every variable and every model.
03Where the project changed
The standard ILAMB scorecard evaluates deterministic model performance. It does not test whether PEcAn’s between-member spread is calibrated.
04Agreement is not calibration
What the diagram shows: Each mark is one of the 100 data-assimilation members at a single site. They begin apart and settle into a narrow cluster. The benchmark value lies outside the ensemble’s narrow central range.
Diagram. One hundred ensemble members converge into a narrow cluster while the observation remains far outside the ensemble’s central 90% range, so the ensemble spread is much smaller than its error.
Schematic: The spread is the width of the ensemble, and the error is the distance from the ensemble to the observation. Calibration asks whether ensemble spread is commensurate with realized error across many observations.
05Spread divided by error
For this diagnostic, a spread-to-error ratio near 1.00 indicates that ensemble spread is appropriately sized relative to realized error. Values far below 1.00 indicate underdispersion. Measured across the whole domain against the benchmarks used here, PEcAn’s three ratios are 0.07 for biomass, 0.15 for soil carbon and 0.20 for leaf area index.
Read the gap to 1.0, not just the bar height: It is the distance each variable falls short of a calibrated ensemble. These are bias-removed spread-to-error ratios measured across the whole domain. The second diagnostic, 90% coverage, agrees with them, because far fewer than the expected 90% of observations fall inside PEcAn’s central 90% interval for every variable.
06The measurement
The same diagnostics applied to CMIP6 and TRENDY place those ensembles substantially closer to their reference values than PEcAn. These represent different kinds of uncertainty. PEcAn is a within-model data-assimilation ensemble, while CMIP6 and TRENDY represent structural disagreement across different models. The comparison here concerns uncertainty calibration, not deterministic accuracy.
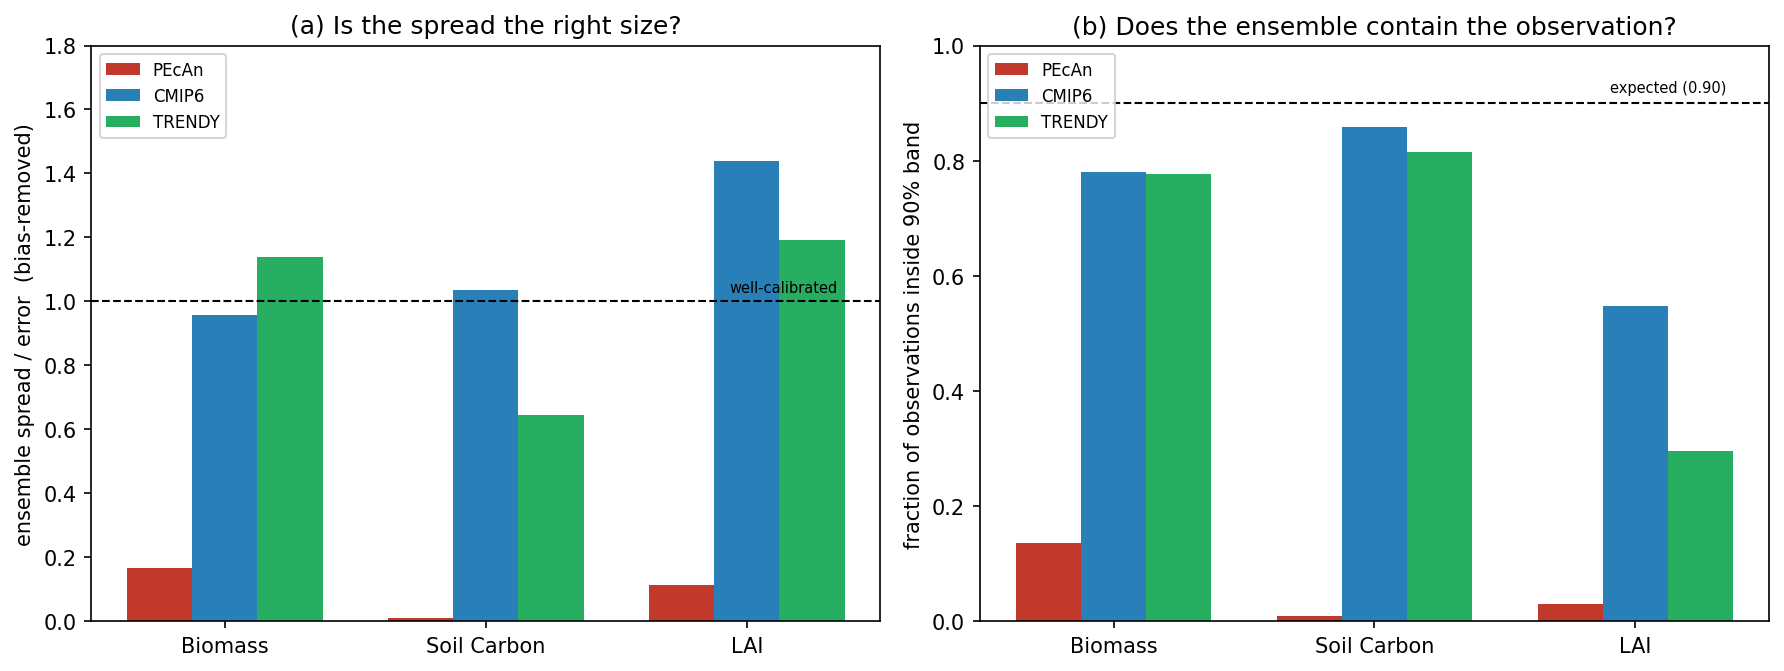
Two views of ensemble calibration: Panel (a) is the bias-removed spread-to-error ratio against the well-calibrated value of 1.0, and panel (b) is the fraction of observations inside each ensemble’s central 90% range against the expected 0.90. The dashed lines are the reference values in both panels.
07Robustness
A calibration result is only as informative as the reference it is measured against, so biomass was re-scored against a second independent product, then re-scored again with the benchmark’s own uncertainty folded in.
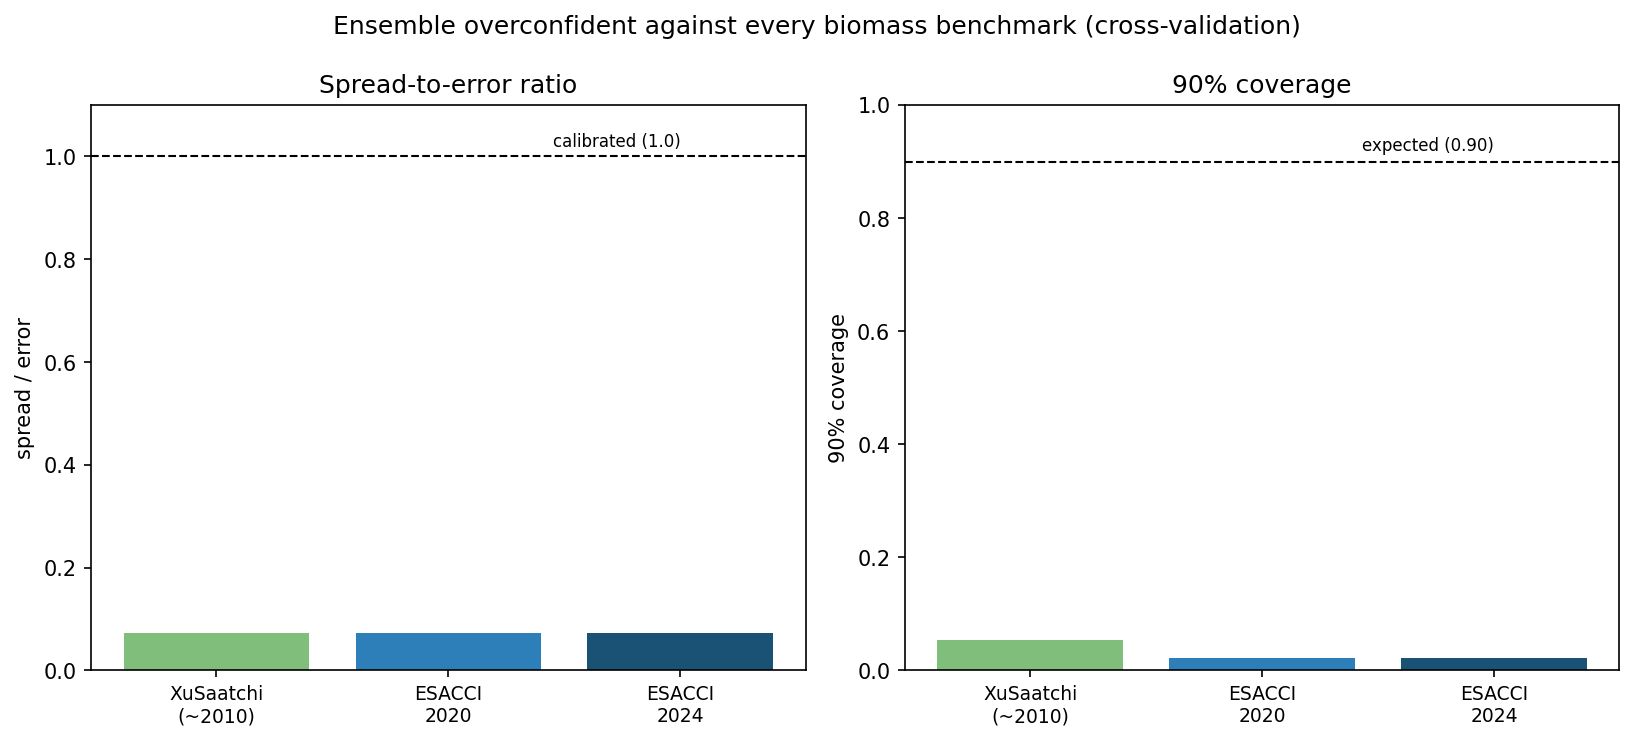
Biomass against three benchmarks: XuSaatchi and ESA-CCI in both 2020 and 2024 give almost identical ratios, so the result is not specific to a single observational benchmark.
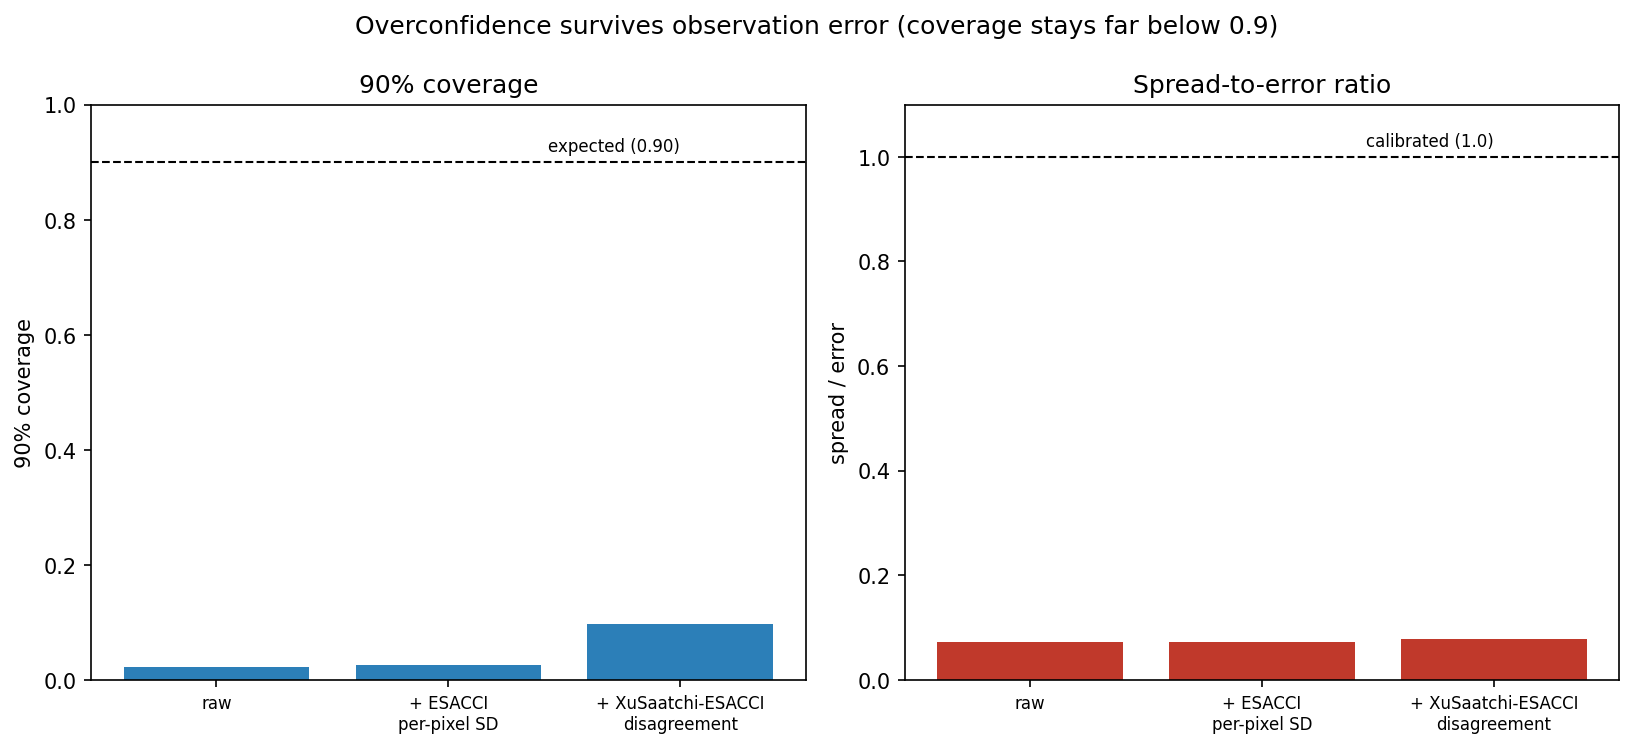
Accounting for benchmark uncertainty: Biomass coverage rises from roughly 0.02 to roughly 0.10, still far below the expected 0.90. The spread-to-error ratio changes only modestly, so benchmark uncertainty does not account for most of the observed underdispersion.
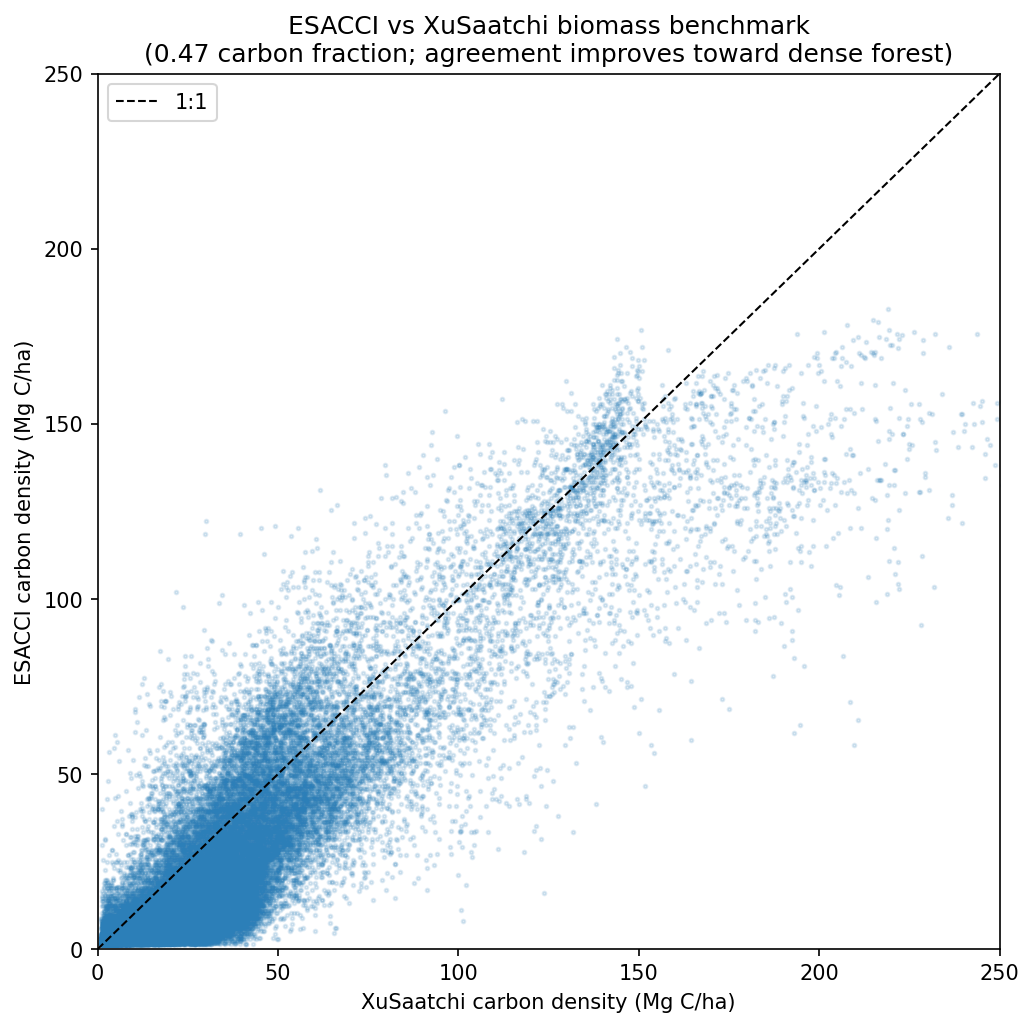
The two products disagree with each other, most of all at low carbon density: That disagreement is itself one of the observation-error terms used in Fig. 04, which is why the robustness check is strongest for biomass. The soil-carbon and LAI reference datasets used here do not carry published per-pixel uncertainty layers, so the same test cannot be run on them.
08Where it happens
Rather than report a single continental number, the same calibration engine was rerun on subsets of sites, first by MODIS land-cover class and then by EPA and CEC ecoregion. Every class and every tested Level 1 ecoregion stays below the calibrated ratio. The breakdown shows where the miscalibration is most pronounced.
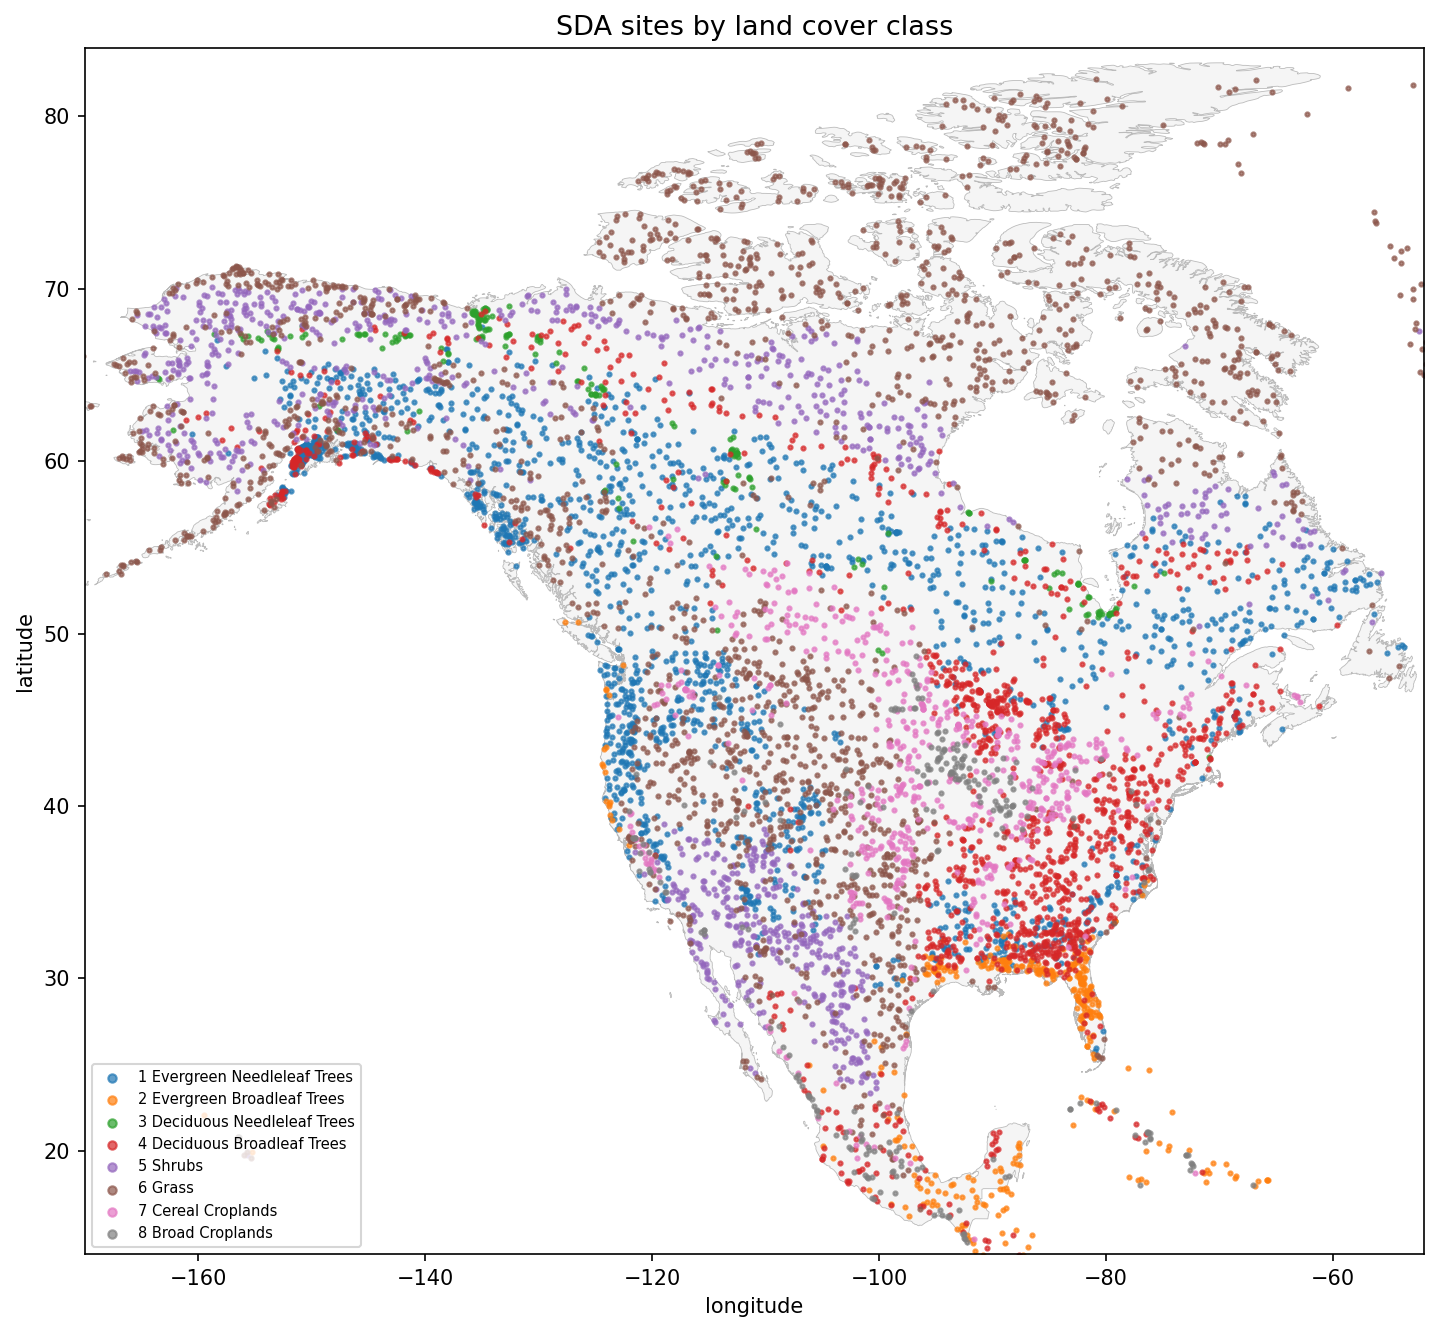
The assimilation network: Roughly 8,000 SDA sites, coloured by land-cover class.
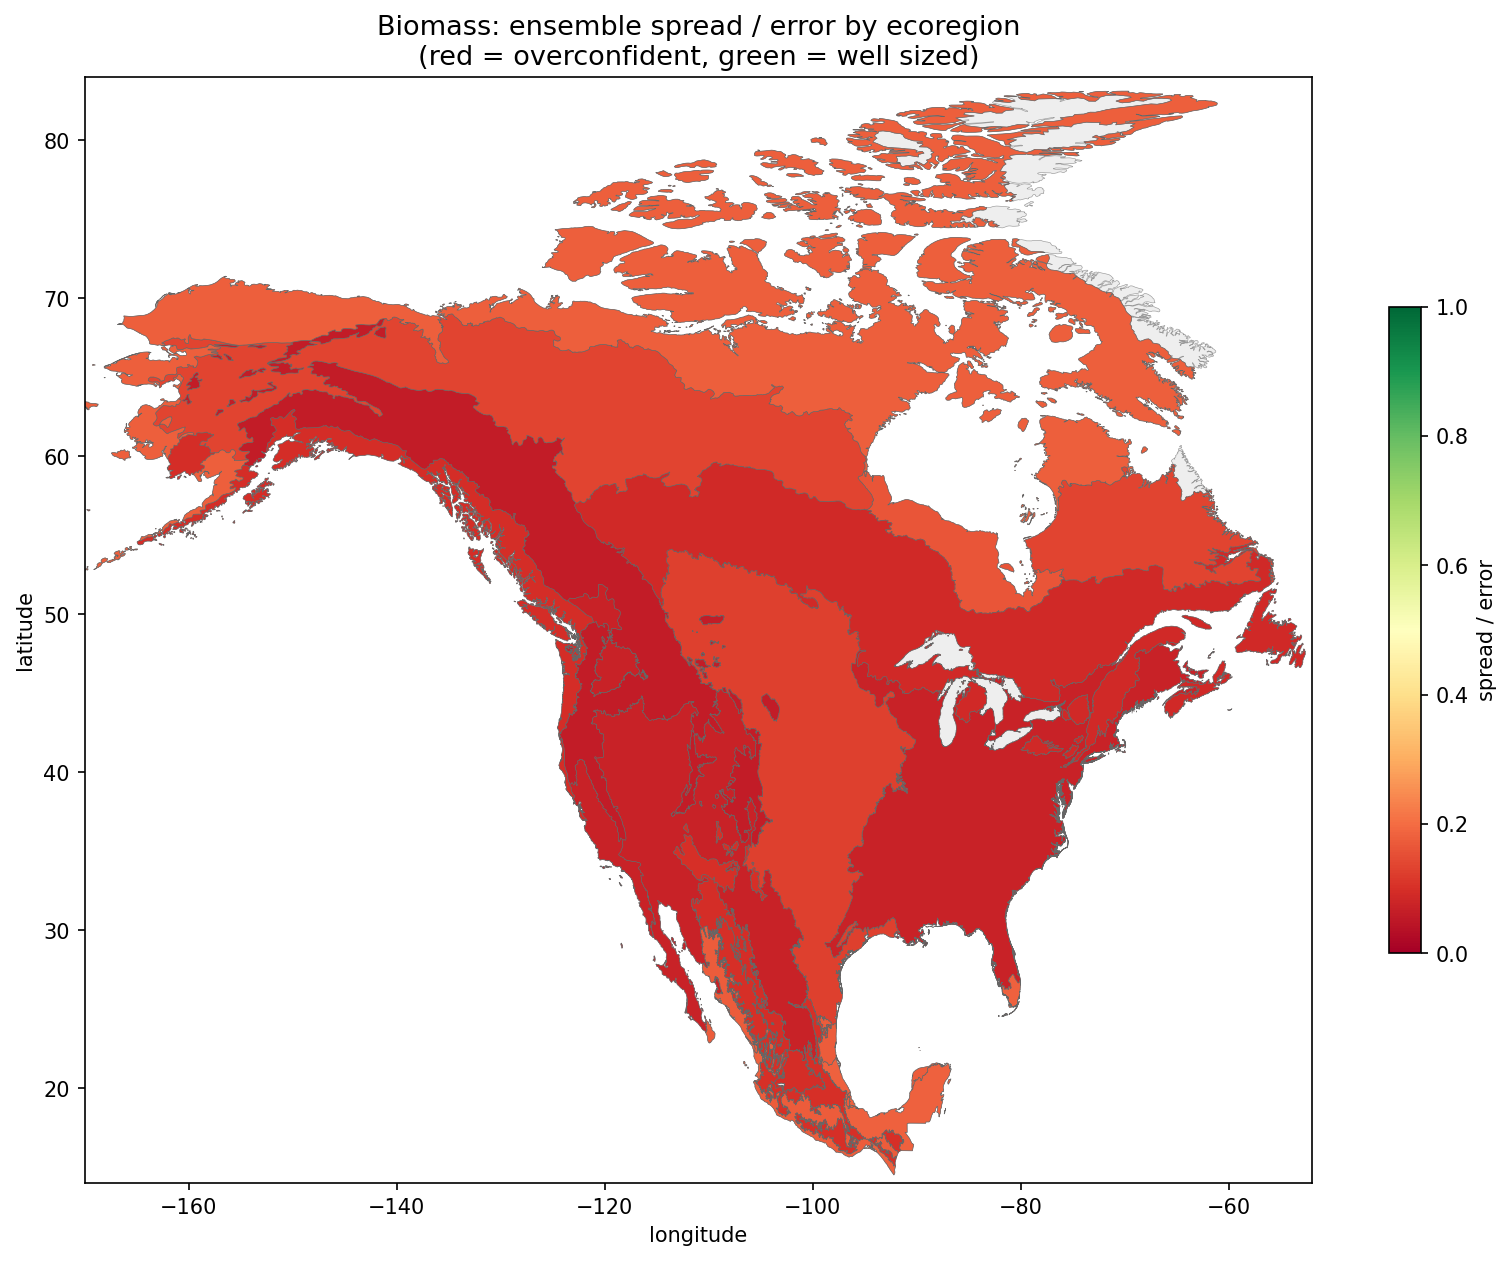
Biomass ratio by ecoregion: Values near 1.0 indicate well-sized spread, while lower values indicate increasing underdispersion.
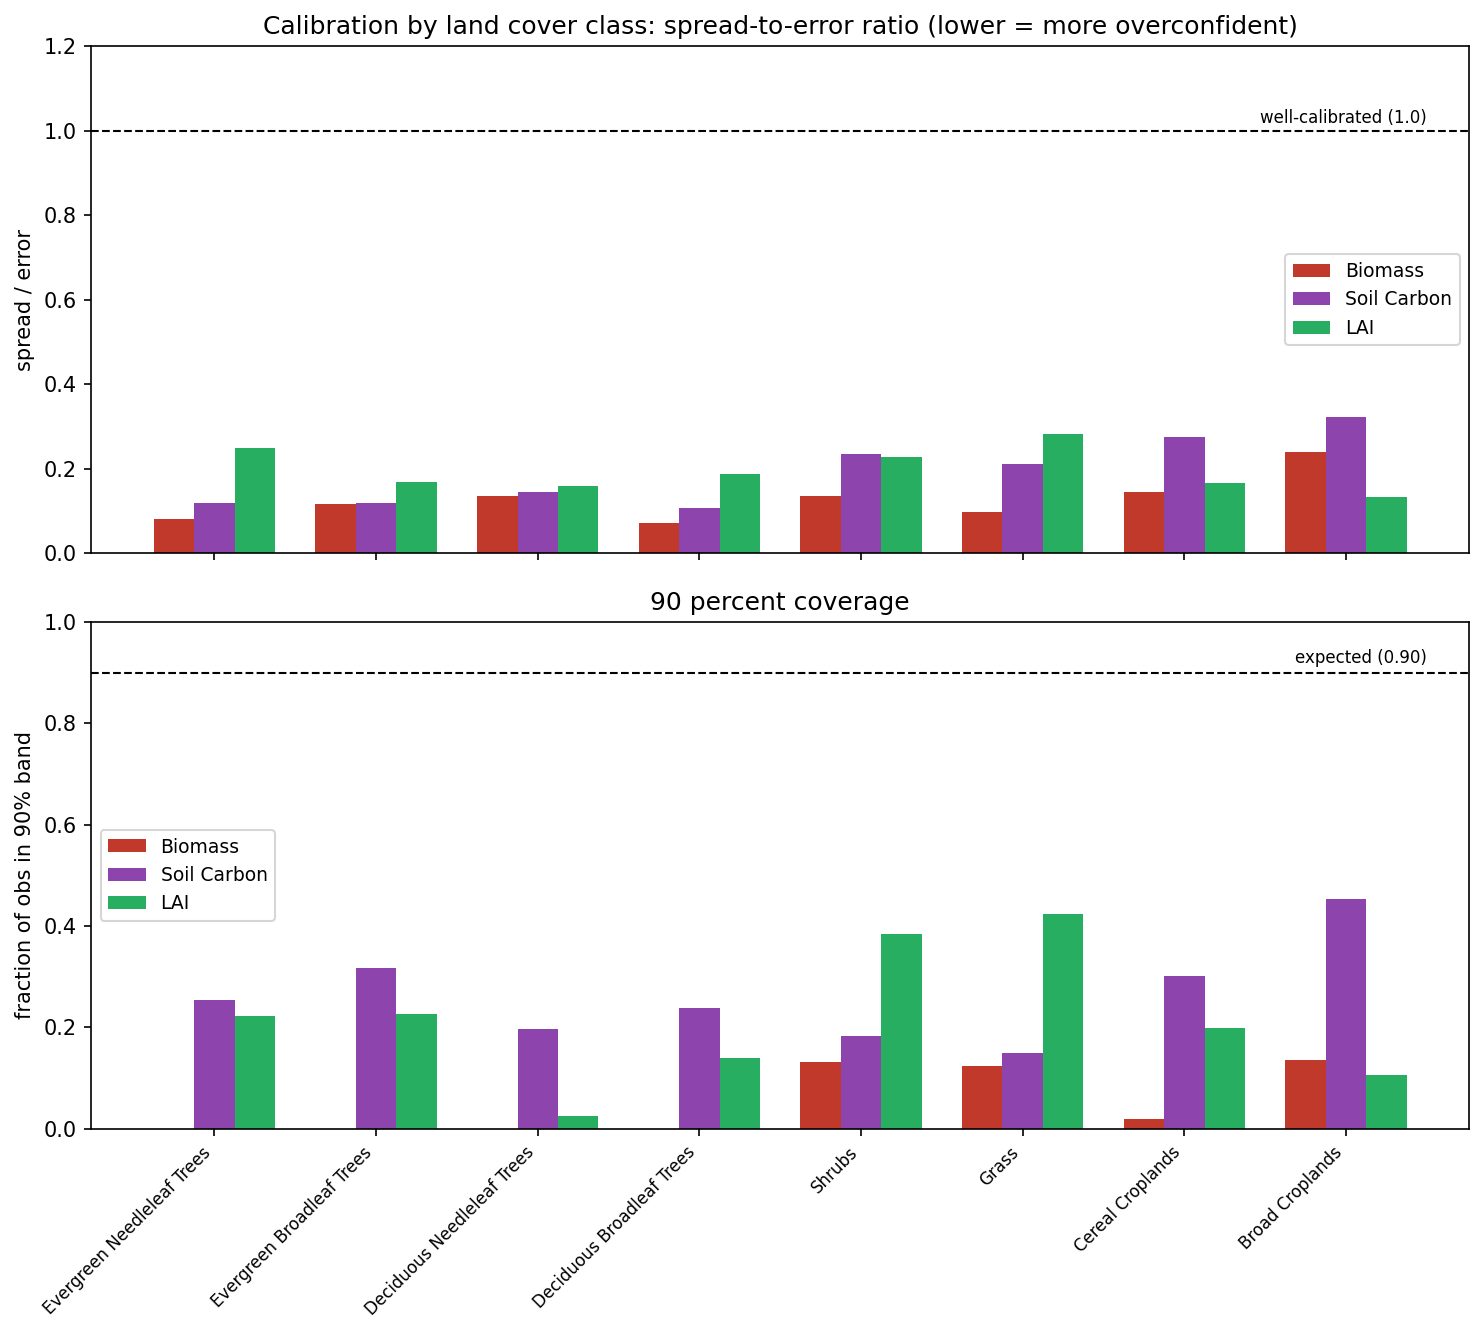
By land cover: Every land-cover class remains below the calibrated spread-to-error ratio. Biomass coverage is effectively zero across the four forest PFT classes.
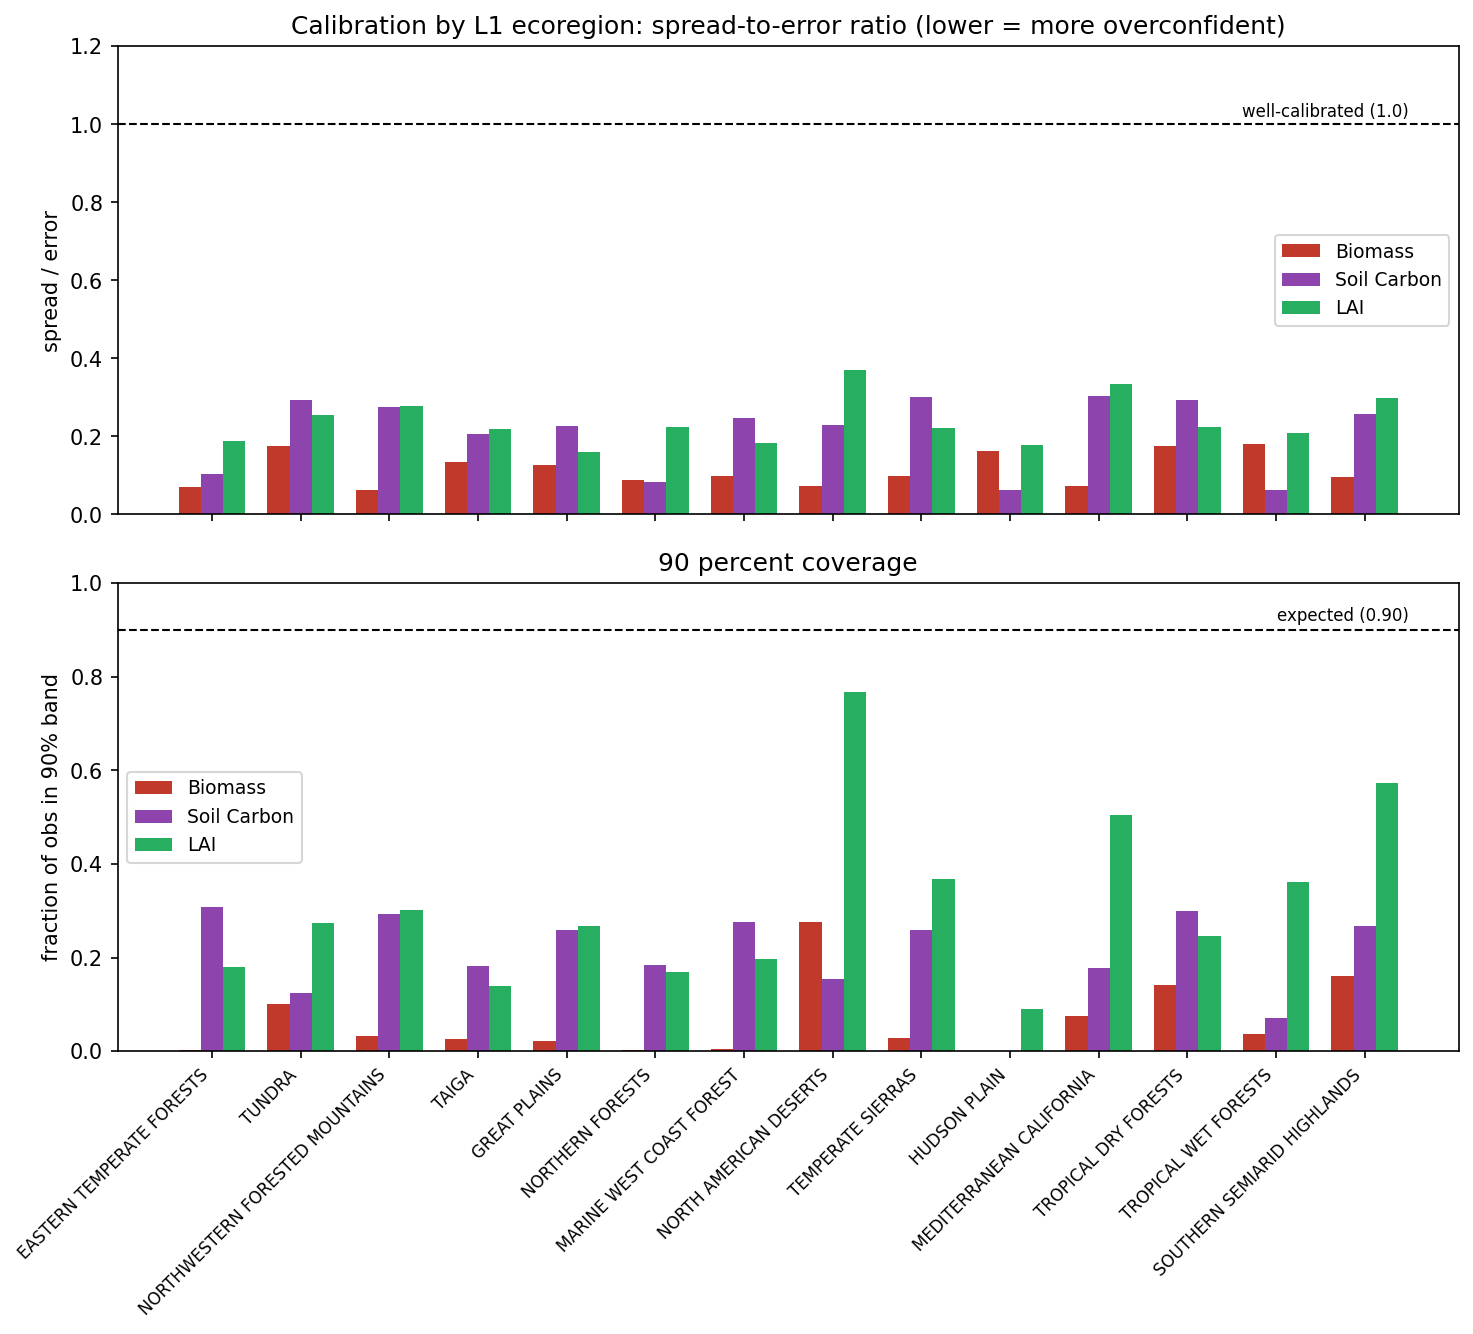
By ecoregion: All fourteen tested Level 1 ecoregions remain below the calibrated spread-to-error target, and 90% coverage remains below its expected value throughout the domain.
09One omitted uncertainty source
Every ensemble member is carried to the 1 km grid by its own random forest. The mapped ensemble does not explicitly propagate the predictive error quantified by each random forest’s out-of-bag residuals. Comparing OOB RMSE with between-member spread at the same sites and in the same units therefore provides a diagnostic of an uncertainty source that may be missing from the reported spread.
Both variables are shown on the same scale: Green marks the between-member ensemble spread, while the lighter segment extends to the random forest out-of-bag RMSE. For biomass, OOB RMSE is 2.76× the ensemble spread. For soil carbon, it is 1.42×. Zhang et al. note that emulator training uncertainty is not propagated into the mapped uncertainty, making downscaling one plausible omitted uncertainty source consistent with the observed underdispersion. This diagnostic does not establish that it is the only source.
10Contributions
The arc runs from raw format conversion through the full calibration analysis and its regional and mechanistic breakdowns. All seven are merged into PEcAn’s develop branch.